GE 1.5XLE Wind Turbine Analysis
Aerodynamic loading effects on wind turbine blades
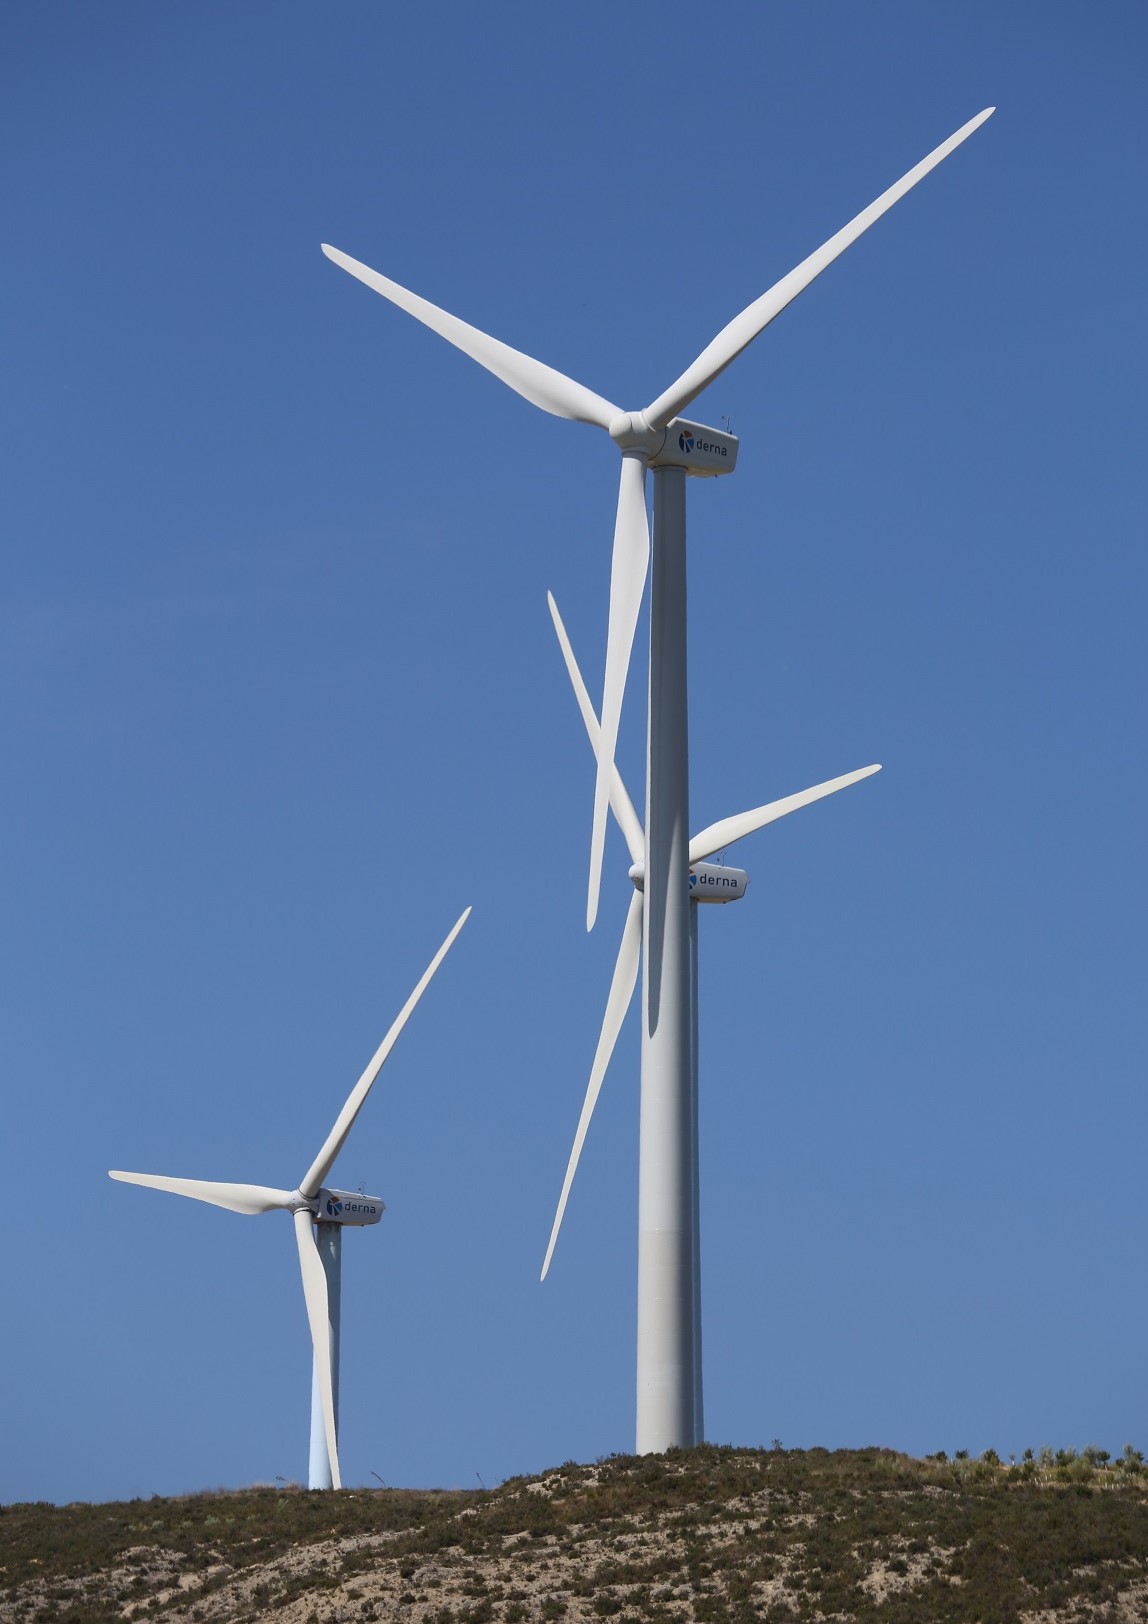
Wind turbines are a source of renewable energy that operate by converting the wind's kinetic energy into usable electrical energy. The following model will simulate the airflow around turbine blades and correlate that to the amount of deflection and stress the blade experiences due to the fluid motion. The wind turbine properties used in this model come from the General Electric's 1.5 MW Series turbine or the GE 1.5XLE.
Mesh & Model Setup
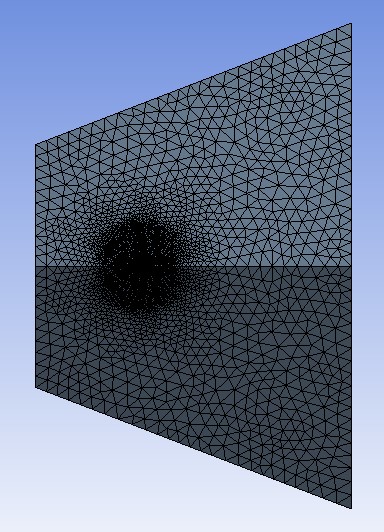
Mesh in the X-Y Plane
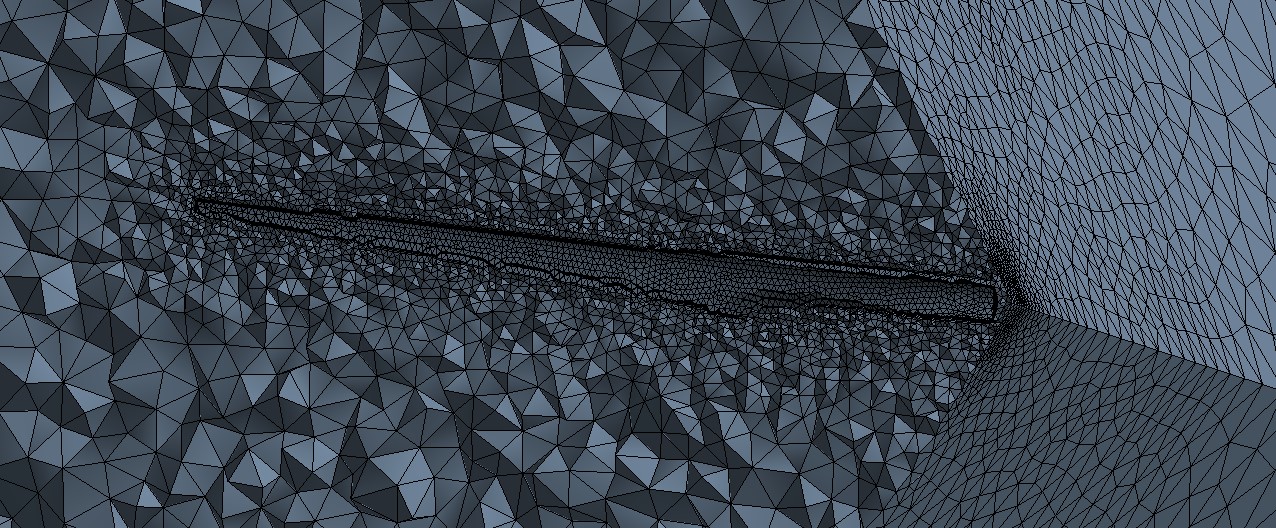
Zoomed in Mesh in the X-Y Plane
Mesh in the Y-Z Plane
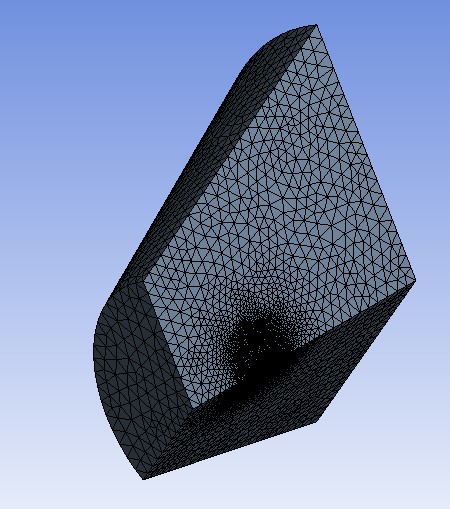
Mesh Isometric View
Mesh in the X-Y Plane
Mesh in the Y-Z Plane
Mesh Isometric View
Mesh Section Plane View
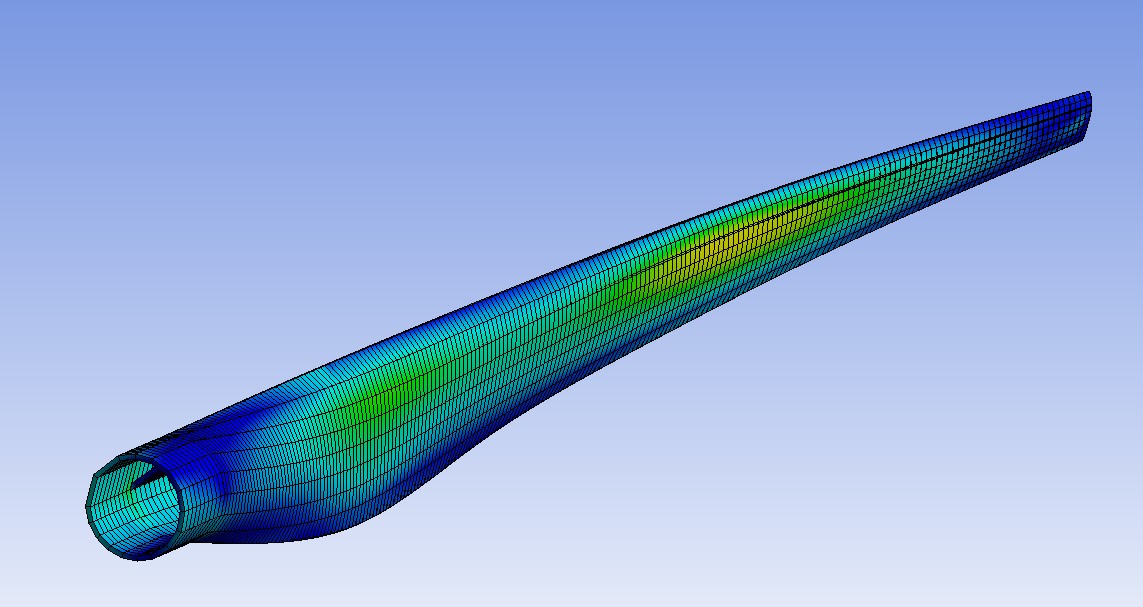
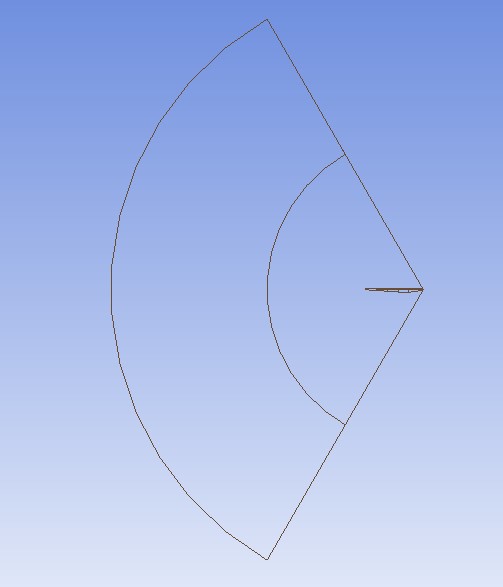
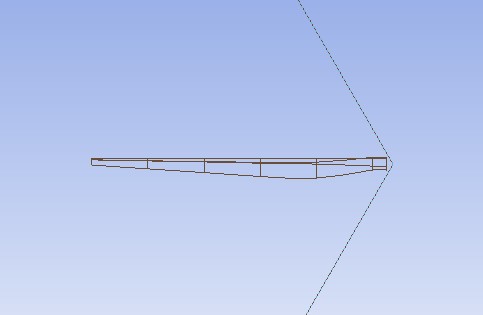
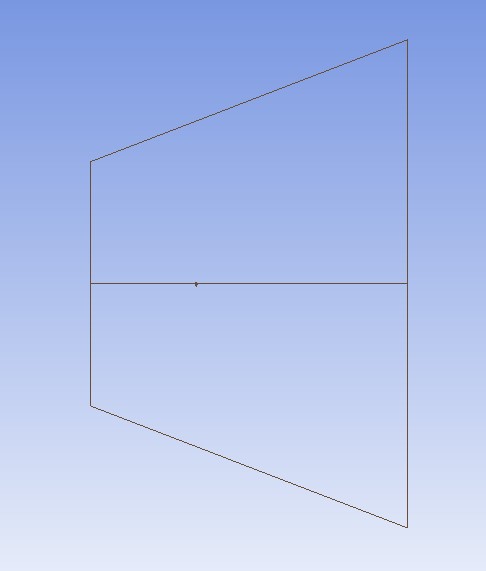
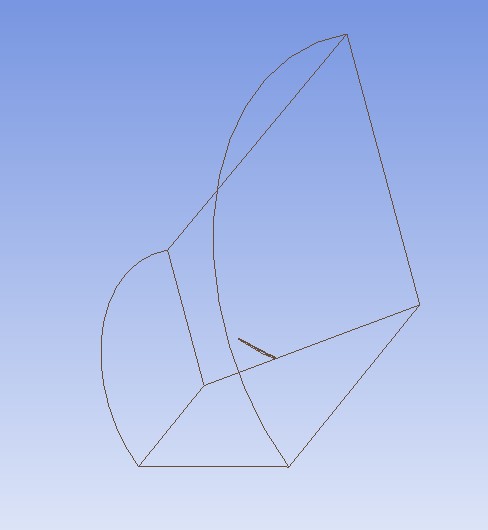
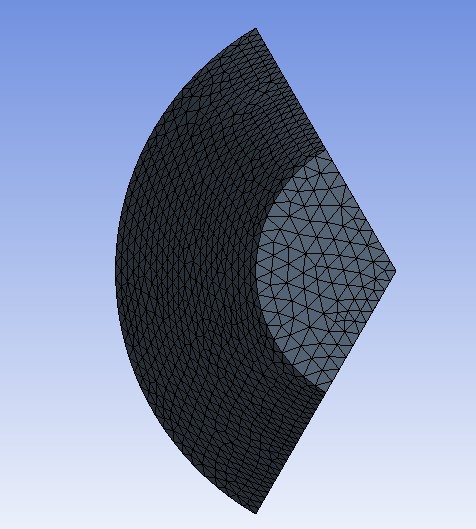
The geometry and mesh of the wind turbine was simplified to be one blade in a 120° mesh with there being 3 blades total. From the above mesh, it can be seen that the fluid mesh is larger towards the trailing edge with less of the volume being at the leading edge. Additionally, the mesh is finer closer to the turbine blade as that is the main area of interest. This is done with by using the sphere of influence and inflation settings around the surface of the blade. The blade geometry itself is 43.2 meters long with airfoil transitions similar to those of the GE 1.5XLE turbine blade.
After completing the turbine blade mesh, the model on Fluent was setup as a SST k-omega turbulence model. Additionally, the model was put in a rotated frame of reference with a rotational velocity of -2.22 rad/s
Results
Velocity Arrows in the Y-Z Plane with Section Plane
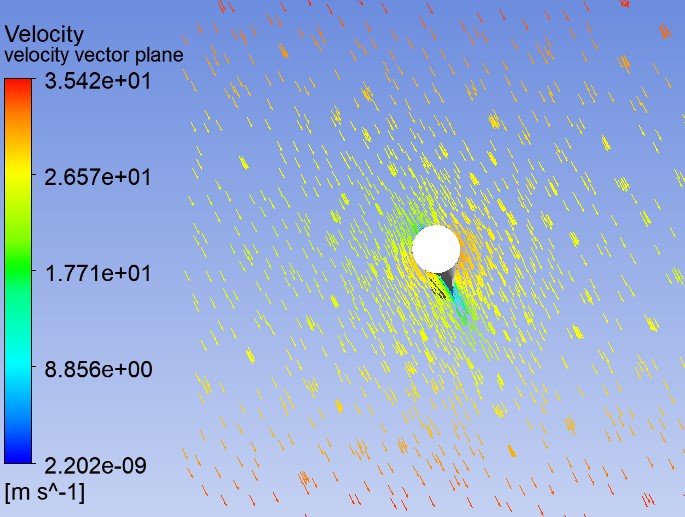
Velocity Arrows in the Y-Z Plane
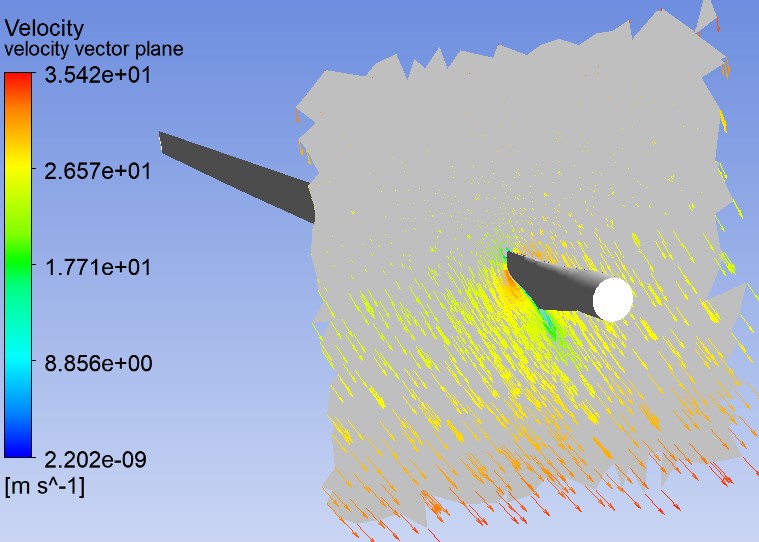
Velocity In Stationary Frame
Pressure Contour in the Y-Z Plane with Section Plane
Pressure Contour of the Turbine Face
Pressure Contour of the Turbine Back
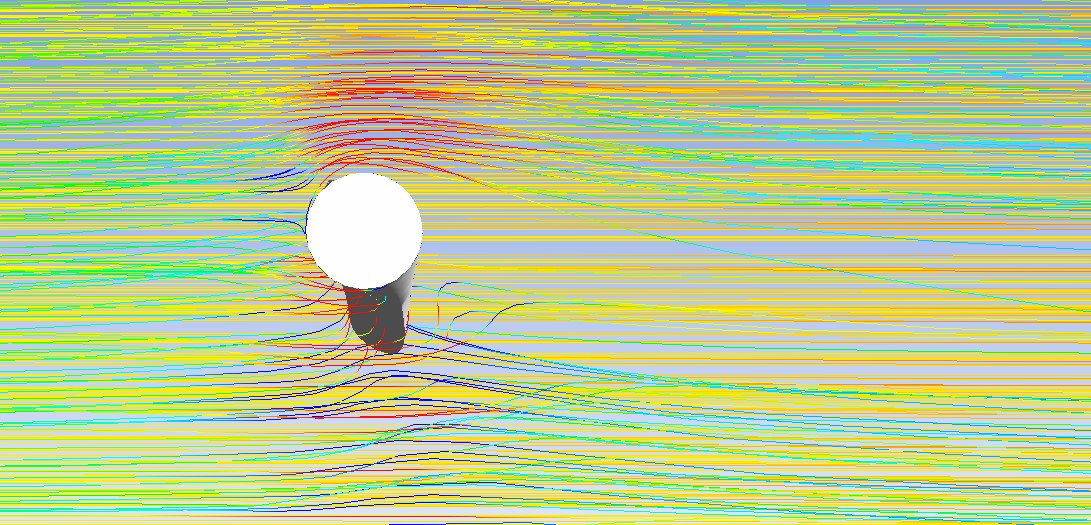
In the stationary frame figure, it can be see that the velocity at the tip of the blade is around 98 m/s which is close to the theoretical at 95.9 m/s (2.22 rad/s * 43.2 m). From the pressure contours, a larger concentration of air particles is seen to build up in the front of the turbine blade. This creates a high pressure area while directly behind the blade there is a low pressure area. This pressure difference between the front and back surfaces will create a lift force in the negative z direction that will in turn cause deflection and stress on the blade.
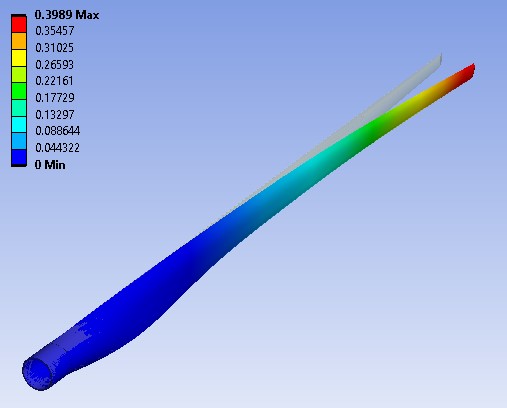
Deflection of Turbine Blade
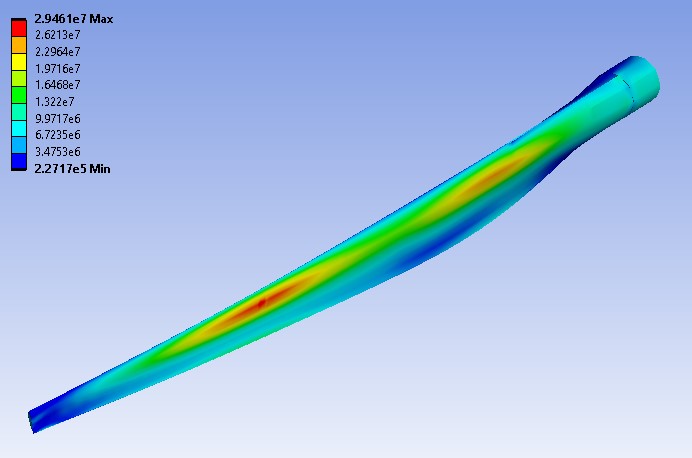
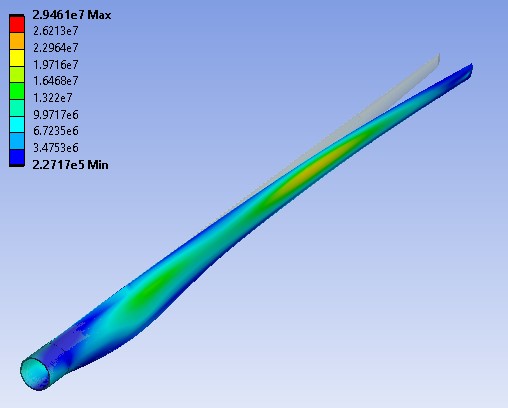
Turbine Blade Stress at Front Surface
Turbine Blade Stress at Back Surface
Using ANSYS Mechanical, deflection of the turbine blade can be seen to be primarily towards the flapwise or z direction. The max deflection, which is seen at the tip of the turbine blade was found to be around 0.4 meters using a wind speed of 12 m/s. Also, von Mises stresses were maximized at the front of the blade with a value of 29.46 MPa. Coversely, the minimum value found mainly on the back face is 0.23 MPa.
Error Analysis
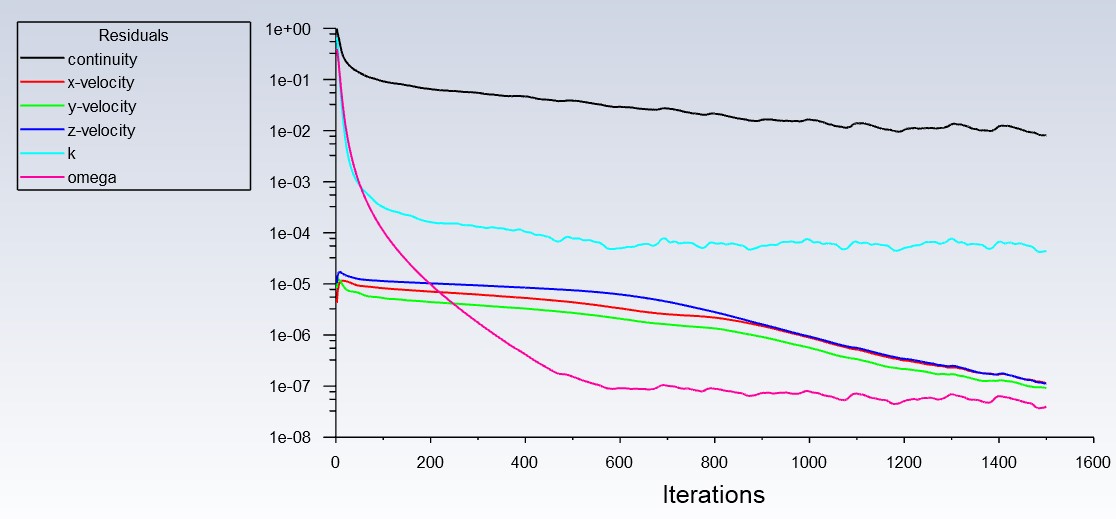
Iteration Chart
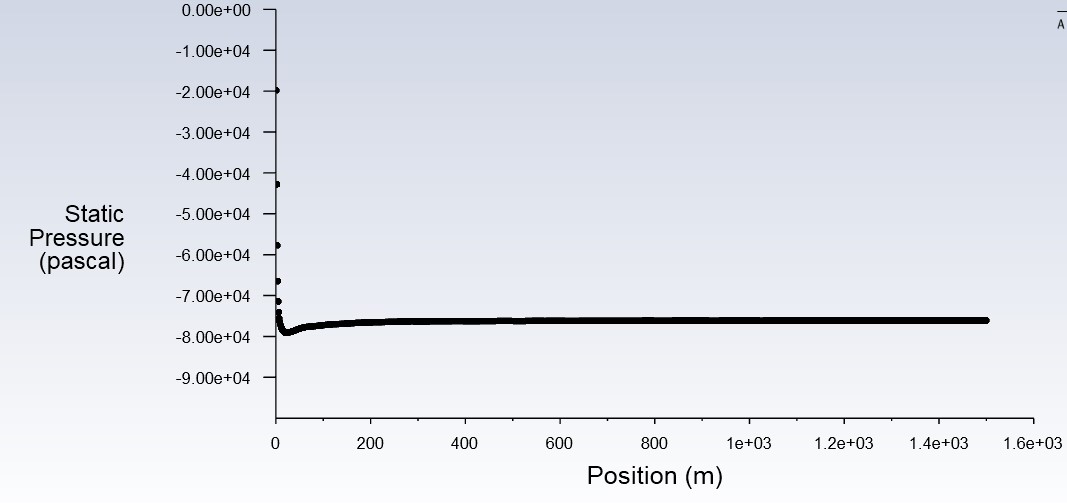
Integral Static Pressure Convergence
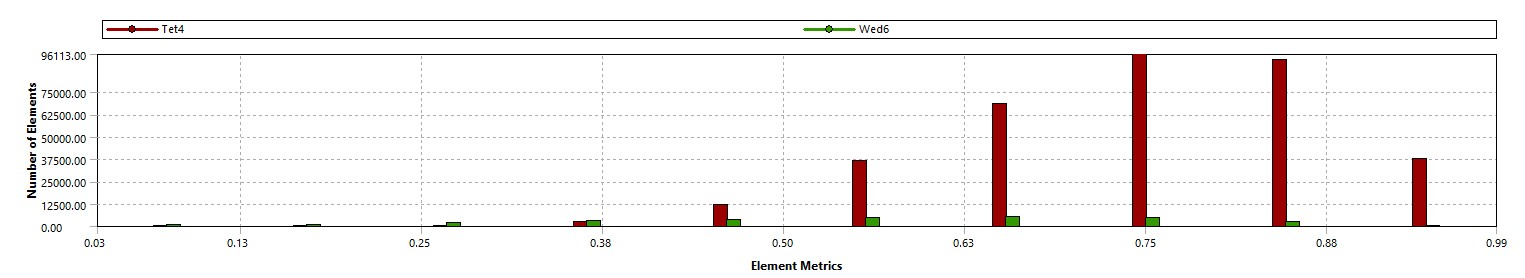
Mesh Skewness
Mesh Orthogonal Quality
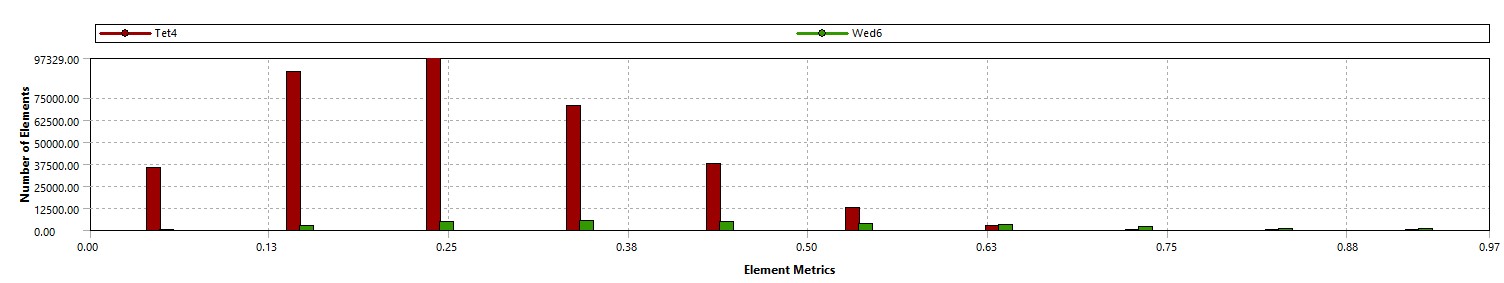
Assumptions were made in the creation of this model for simplicity including linearly increasing thickness of the blade and spar, no gravity load, and no adhesives. When setting the number of iterations on Fluent, a value of 1500 was used due to computing time. It can be seen in the iteration chart that the values continue to trend down or converge meaning that more iterations would generate a more accurate value and less linearization error. However, looking at a value like the integral static pressure convergence shows that the iterations were fairly approximate since the chart shows a straight line and doesn't change much after 300 iterations. Finally, in terms of the mesh, it could have definitely been refined as it had an average skewness of 0.266 and an orthogonal quality of 0.733. Perfect values of skewness and orthogonal quality would be 0 and 1, respectively, meaning that there is some discretization error that affected the accuracy of this model.